 is selected
in Plot->Layout->Curve Styles and
Colors
.
is selected
in Plot->Layout->Curve Styles and
Colors
.The waterfall plotted as separate lines. In the example below
the line type is selected
in Plot->Layout->Curve Styles and
Colors
.
One advantage of this mode is that slices containing more than 2000 points can be plotted. This is currently not possible with the other modes, so if more than 2000 points are tried to be plotted WinMLS will give a warning and automatically switch to this mode.
Another advantage of this mode is that the  and
and  buttons on the Active Plot Type Toolbar can be used to set the active slice for
reading cursor values on the Status Bar (displayed at the bottom of the
WinMLS area as shown in the figure above).
buttons on the Active Plot Type Toolbar can be used to set the active slice for
reading cursor values on the Status Bar (displayed at the bottom of the
WinMLS area as shown in the figure above).
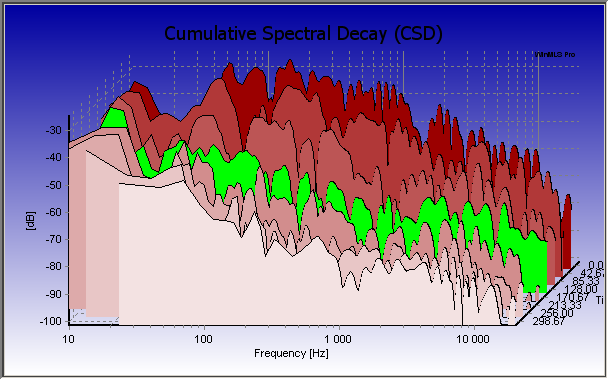
In the figure above we see that the waterfall slices start with a red color and then gradually changes to white. You may change the the starting color from Plot->Layout->Curve Styles and Colors by clicking on the color to the right of curve 1 as shown below.